
Description
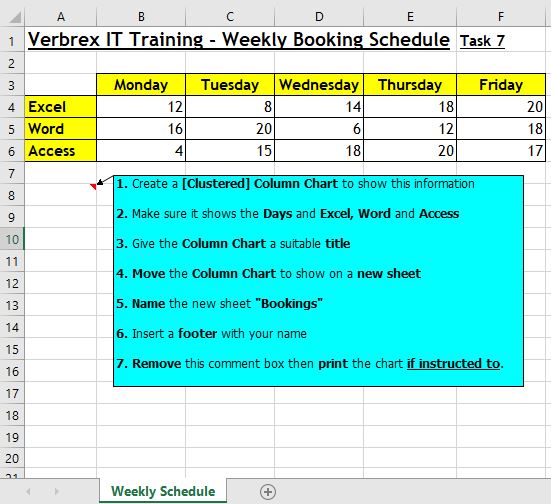
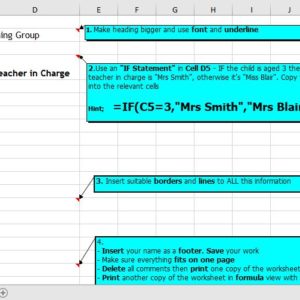
This unit begins with basic pie charts, line, bar and column graphs being created from a variety of data. There is emphasis on labelling the x and y axis correctly and giving each graph an appropriate title. There is practise of moving graphs to a separate sheet and re-naming sheets. The last 4 tasks focus on extracting information from a range of data then creating the relevant graph (ie using the CTRL button to highlight specific information).** Suggested solutions are also included**
Reviews
There are no reviews yet.